
Figure 8.
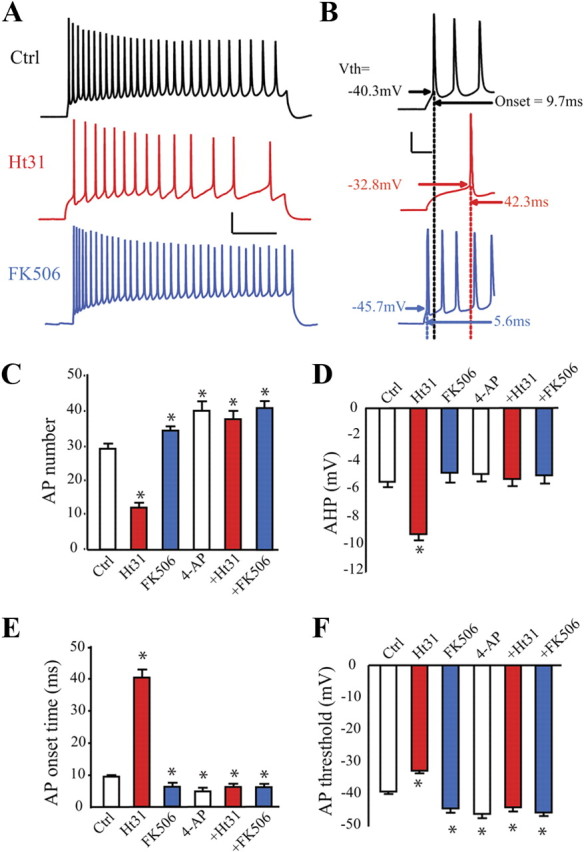
PKA anchoring controls hippocampal neuron excitability. A, Traces in response to a 1000 ms, 200 pA current injection for control hippocampal neurons (black trace), neurons treated with Ht31 peptide (red trace) or the calcineurin (protein phosphatase 2B) inhibitor FK506 (blue trace). Calibration: 20 mV, 200 ms. B, Expanded traces from A to more clearly depict AP onset time and threshold. Scale bar: 20 mV, 20 ms. C, The number of APs recorded from control neurons (no drug treatment, open bar), from neurons treated with intracellular Ht31 peptide (red bar), with FK506 (blue bar), with 5 mm intracellular 4-AP (second open bar), with 4-AP + Ht31 (second red bar), or with 4-AP + FK506 (second blue bar) over the course of 1 s for a 200 pA current injection. After 15 min treatment, AP number is significantly decreased by Ht31 application (n = 10 for Ctrl, n = 8 for Ht31), increased by FK506 (n = 9), 4-AP (n = 12), 4-AP + Ht31 (n = 13) and 4-AP + FK506 (n = 12) application. D–F, Pooled data showing first AP onset time, AHP data and AP threshold for control neurons (open bars, n = 10), or neurons treated with Ht31 peptide (red bars, n = 8), FK506 (blue bars, n = 9), 4-AP (second open bar, n = 12), 4-AP + Ht31 (second red bar, n = 13), or 4-AP + FK506 (second blue bar, n = 12). *p < 0.05.