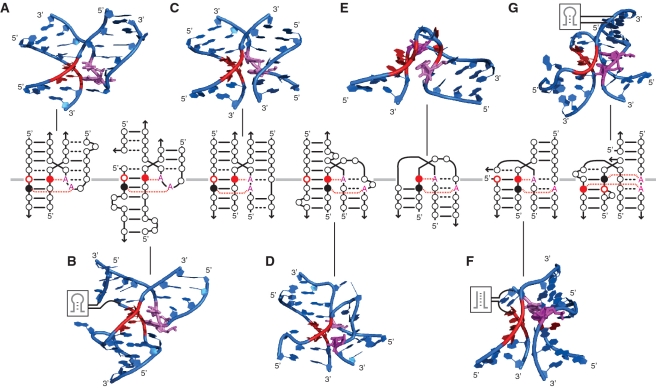
Figure 7.
Motifs following the parallel helix A-minor junction topological rule. In the diagrams, nucleotides are indicated by circles. WC bps are shown as solid lines, and non-WC bps are shown as black dashed lines. The Type I A-minor interactions are indicated by the red A interacting with solid red circle. Type II A-minor interactions are indicated by the red A interacting with solid black circle. (A) GNRA/helix A-minor junction: region H57–H59 from H. marismortui 23S rRNA (PDB ID:1JJ2). (B) Triloop/2x_bulge receptor A-minor junction: region H68–H70 from H. marismortui 23S rRNA (PDB ID:1JJ2). (C) gA:gAA/helix A-minor junction: region H57–H59 from E. coli 23S rRNA (PDB ID: 2AW4). (D) Expanded kink turn (A-minor 3WJ_ABC junction): eukaryotic TPP riboswitch (PDB ID:2CKY). (E) Kink turn: H. marismortui 23S rRNA (PDB ID:1JJ2). (F) Bulged-G/helix A-minor junction (A-minor 3WJ_ACD junction): Oceanobacillus iheyensis Group II intron (PDB ID: 3BWP). (G) Internal loop/helix A-minor junction (A-minor 3WJ_ACD junction): region H14-15-16 from H. marismortui 23S rRNA (PDB ID:1JJ2). Structural models were visualized in PyMOL (pymol.sourceforge.net).

