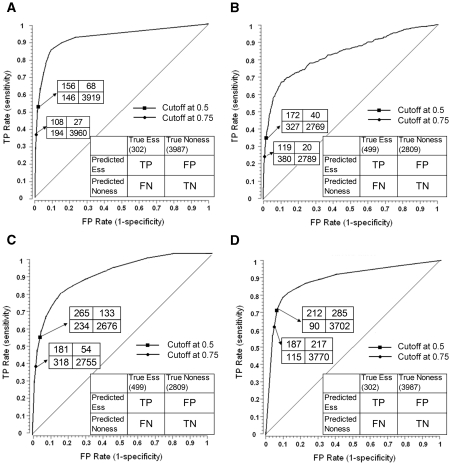
Figure 3.
ROC curves plot the TPR versus FPR for different thresholds of classifier probability output. (A) and (B): EC → AB; (C) and (D): AB → EC. (A) Ten-fold cross-validations on the EC essential gene data set. (B) Predictions of AB essential genes. The classifier was trained on EC dataset and evaluated on AB essential genes. (C) Ten-fold cross-validations on the AB essential gene data set. (D) Predictions of EC essential genes. The classifier was trained on AB data set and evaluated on EC essential genes.

