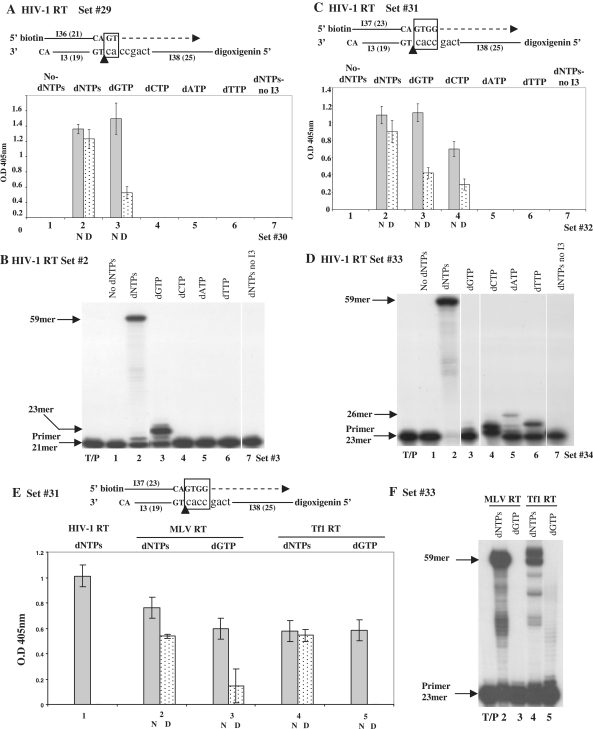
Figure 6.
ELISA-based DNA-binding assay with RTs of HIV-1, MLV and Tf1. The DNA-binding assay was conducted, as described schematically in Supplementary Figure S2. In (A), (C) and (E), ‘N’ marks the native and ‘D’, the heat-denatured reactions. In all schematic descriptions of the substrates used, the squares indicate the clamp regions. (A), (B), (C) and (D), tested with HIV-1 RT. The descriptions of all columns and gel lanes are indicated. Control reactions of RT+dNTPs+T/P (without I3) were conducted with set #30 (in A); set #3 (in B); set #32 (in C) and set #34 (in D), see Supplementary Table S2 for a schematic description. The bars represent the ranges calculated from at least three independent reactions. (A) DNA-binding assay with set #29. (B) Urea–PAGE analysis of the clamp/polymerase activity with set #2. (C) DNA-binding assay with set #31. (D) Urea–PAGE analysis of the clamp/polymerase activity with set #33. (E) and (F), tested with MLV RT or Tf1 RT, as indicated. (E) is a binding assay and (F) is a gel assay.

