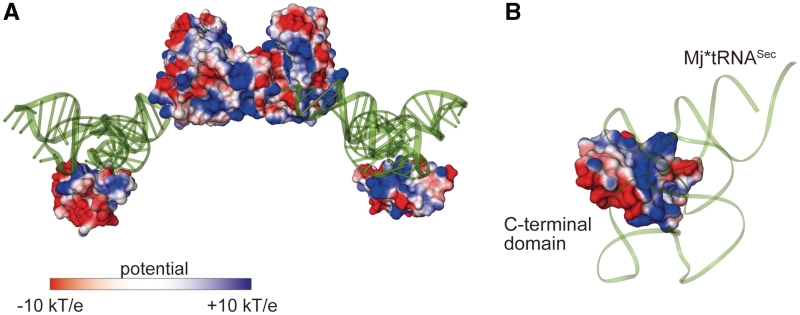
Figure 4.
The electrostatic surface potential model. (A) The protein electrostatic surface potential model of the MjPSTK•Mj*tRNASec complex, calculated by the program APBS (24). The Mj*tRNASec molecules are shown by tube model and colored green. (B) Close-up view of the interaction surface between the C-terminal domain and D-arm.

