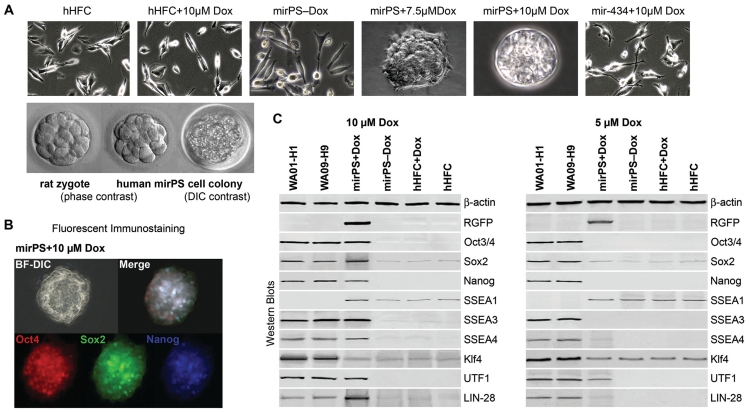
Figure 2.
Morphological and genetic changes of mirPS cell properties in response to different mir-302 concentrations. (A) Morphological changes of mirPS cell colonies in response to Dox-induced mir-302 expression. Mir-434-expressing cells generated by electroporating hHFCs with pTet-On-tTS-miR434-5p were served as a negative control. A morphological comparison between a morula-staged rat embryo and a mirPS cell colony at 32–64 cell stage was shown in the lower panel. (B) Fluorescent microscope examination showing strong and homogeneous expression of the core pluripotent stem cell markers Oct3/4, Sox2 and Nanog in a mirPS-derived embryoid body. BF-DIC, bright field with differential interference contrast. (C) Western blotting confirming the expression patterns of major hES-specific marker proteins in completely (10 µM Dox) and partially (5 µM Dox) reprogrammed mirPS cells compared to those found in hES H1 and H9 cells (n = 4, P < 0.01). Mir-302 expression was proportional to Dox concentration.

