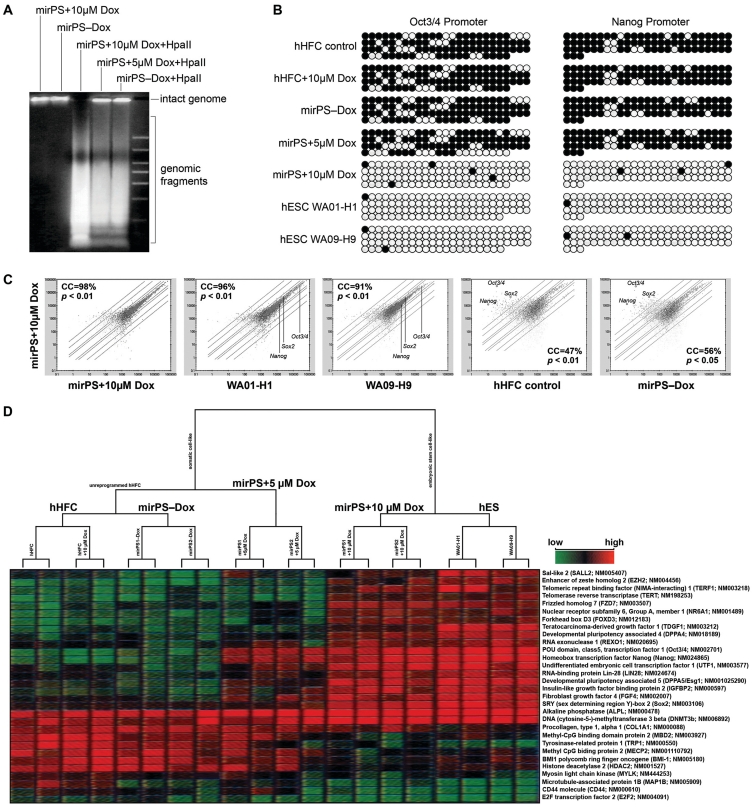
Figure 4.
Mir-302-induced genomic DNA demethylation and global gene expression alteration. (A) HpaII cleavage showing the vast loss of global CpG methylation, identified by increased presence of smaller DNA fragments, at a genome-wide scale in mirPS cells treated with 10 µM but not 5 µM Dox. (B) Bisulfite DNA sequencing in the promoter regions of Oct3/4 and Nanog. Methylation maps show the most frequently observed patterns. Black and white circles indicate the methylated and unmethylated cytosine sites, respectively. (C) Analysis of global gene expression patterns before and after global demethylation, using human genome GeneChip U133 plus 2.0 arrays (Affymetrix; n = 3, P < 0.01–0.05). (D) Microarray hierarchical clustering of the top 30 most differentially expressed hES-specific genes and epigenetic regulators between somatic hHFCs, reprogrammed mirPS-hHFCs (mirPS+10 µM Dox) and hES H1/H9 cells.

