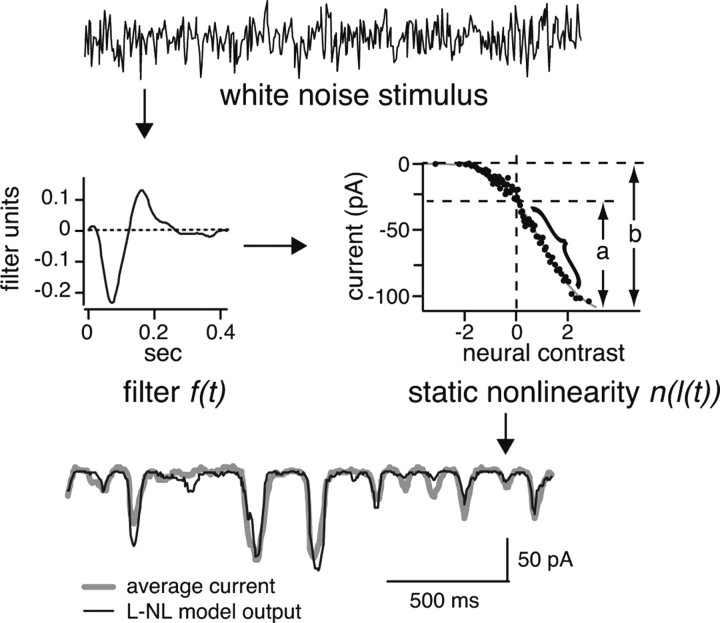
Figure 2.
Measuring gain and rectification from a linear–nonlinear (L–NL) model. The input to the L–NL model is white noise: this passes through two components of the model, a linear filter and a static nonlinearity (middle). The parameters of the model minimize the error between the output of the model and the average of the recorded currents (bottom). Rectification is measured from the static nonlinearity by comparing the range of current signaling the preferred contrast (a) to the total range of current (b) (see Materials and Methods). Gain is measured as the slope of the linear portion of the static nonlinearity (bracket). Note that, in this and subsequent figures, the static nonlinearity of the ON cell is flipped left to right to preserve the convention that an inward (negative) current corresponds to positive contrast.

