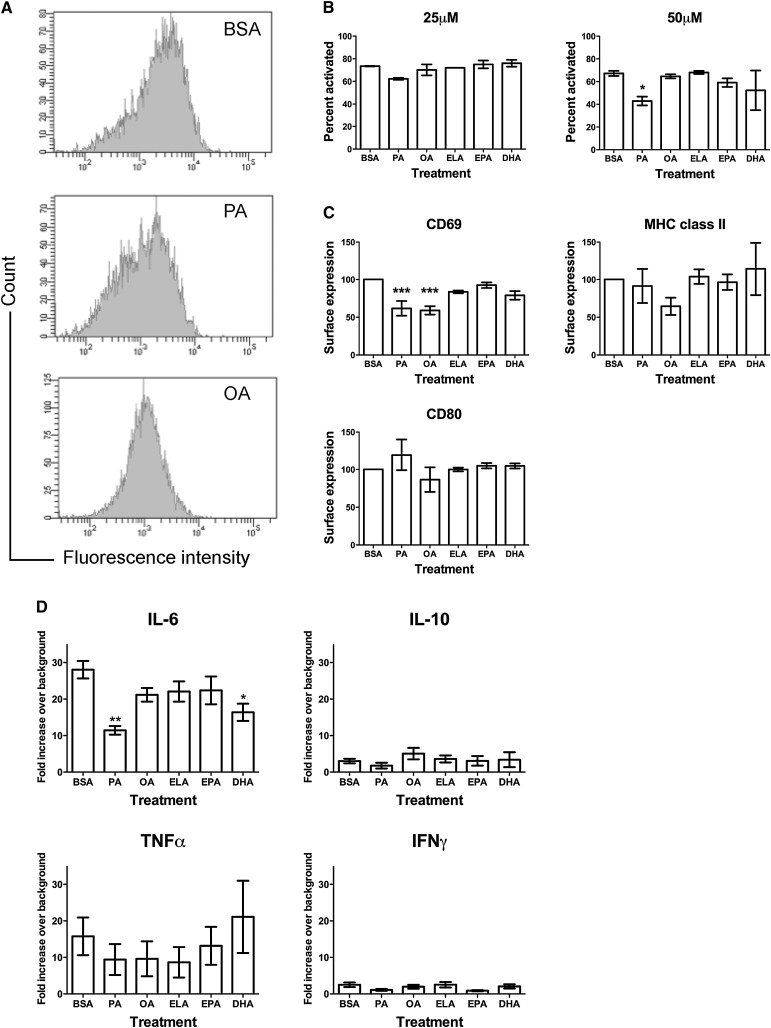
Fig. 1.
Differential effects of fatty acids on the percentage of B cells activated, upregulation of surface molecules, and cytokine secretion. (A) Sample flow cytometry histograms to show staining of the B-cell activation marker CD69. (B) Percentage of B220+ B cells activated with LPS at 48 h after treatment with BSA or 25–50 µM PA, OA, ELA, EPA, and DHA. (C) Surface expression of B cell activation markers CD69, MHC class II, and CD80 after 48 h of treatment with 50 µM fatty acids. (D) Cytokine secretion from B220+ B cells treated with BSA or 50 µM PA, OA, ELA, EPA, and DHA treated for 48 h. Values are mean ± SEM, n = 3–10. Asterisks indicate difference from BSA, *P < 0.05, **P <0.01, ***P < 0.001. DHA, docosahexaenoic acid; ELA, elaidic acid; EPA, eicosapentaenoic acid; LPS, lipopolysaccharide; OA, oleic acid; PA, palmitic acid.

