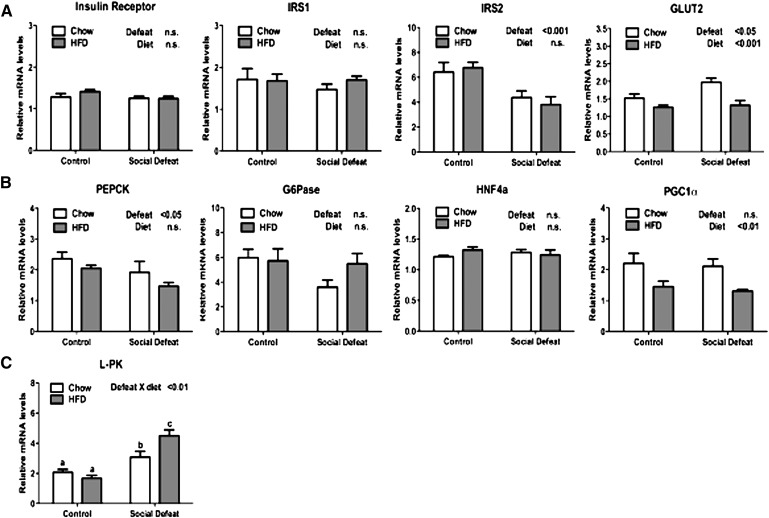
Fig. 4.
Expression of genes that regulate carbohydrate metabolism in liver after CSDS. (A) Relative mRNA levels of genes involved in insulin signaling, including insulin receptor, IRS1, IRS2, and GLUT2. (B) Expression of genes involved in gluconeogenesis: PEPCK, G6Pase, HNF4a, and PGC1a. (C) Expression of the carbohydrate response element binding protein target L-PK. Data are presented as mean ± SEM, with significant differences as an insert on the chart (P < 0.05, P < 0.01, P < 0.001). Groups first tested by two-way ANOVA. If a statistical interaction was observed between factors, comparison of all four groups was performed by one-way ANOVA with Tukey posthoc comparison, and statistically different groups are indicated by different letters. CSDS, chronic social defeat stress; G6Pase, glucose-6-phophatase; GLUT2, glucose transporter 2; HNF4a, hepatocyte nuclear factor 4a; IRS, insulin receptor substrate; L-PK, liver pyruvate kinase; PGC1a, PPARγ coactivator 1a; PEPCK, phosphoenolpyruvate carboxykinase; PPAR, peroxisome proliferator-activated receptor.

