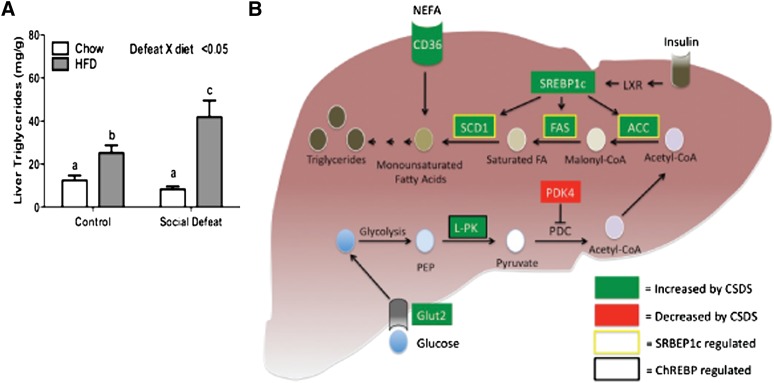
Fig. 6.
Intrahepatic triglyceride accumulation after CSDS. (A) Concentration of triglycerides in the liver. (B) Summary of changes in liver after CSDS. Data are presented as mean ± SEM, with significant differences as an insert on the chart (P < 0.05, P < 0.01, P < 0.001). Groups first tested by two-way ANOVA. If a statistical interaction was observed between factors, comparison of all four groups was performed by one-way ANOVA with Tukey posthoc comparison, and statistically different groups are indicated by different letters. ACC, acetyl CoA carboxylase; ChREBP, carbohydrate-response element binding protein; CSDS, chronic social defeat stress; HFD, high-fat diet; PDC, pyruvate dehydrogenase complex; PDK4, pyruvate dehydrogenase kinase 4; PEP, phosphoenolpyruvate; SCD1, stearoyl CoA desaturase 1; SREBP1c, sterol-regulatory element binding protein 1c.

