Fig. 4.
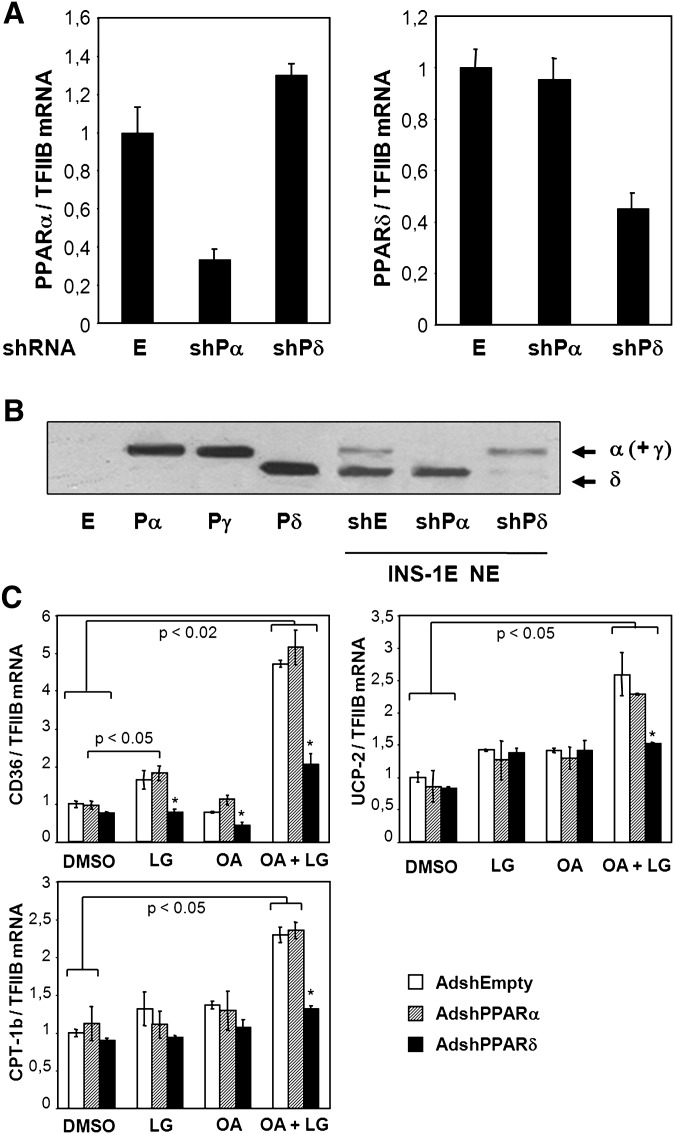
Oleic acid activation of fatty acid handling genes is dependent on PPARδ in insulin secreting cells. INS-1E cells were transduced with adenoviral vectors (∼20 pfu/cell) expressing shRNA targeting PPARα [AdshPPARα (shPα)] or PPARδ [AdshPPARδ (shPδ)] or with empty control virus [AdshEmpty (E)] and cultured for 48 h in RPMI (11 mM glucose) before harvest of total RNA and nuclear protein extracts. A: Expression levels of PPARα and PPARδ were quantified using quantitative PCR, normalized to TFIIB expression, and presented relative to AdshEmpty control transduced cells. B: Nuclear proteins (NE) were separated by SDS-PAGE, and PPAR levels were visualized by immunoblotting. Protein extracts from NIH-3T3 cells ectopically expressing murine PPARα (Pα), PPARγ2 (Pγ), PPARδ (Pδ), or control adenoviral vector (E) were run in parallel as control for protein migration. Arrows indicate migration of the subtypes. C: INS-1E cells were transduced with the indicated adenoviral vectors and cultured for 24 h in RPMI (11 mM glucose) before incubation with DMSO or the fatty acid oleic acid (OA, 100 μM) in the presence or absence of the RXRα agonist LG100268 (0.2 μM) for additional 24 h. Total RNA was extracted, and expression levels of CD36, muscle CPT-1, and UCP2 were quantified using quantitative PCR and normalized to TFIIB expression. Expression levels are presented relative to DMSO control. Results are means of three independent experiments, and P values were calculated by two-way ANOVA. Addition of LG100268 differs from corresponding DMSO control (*P < 0.05).

