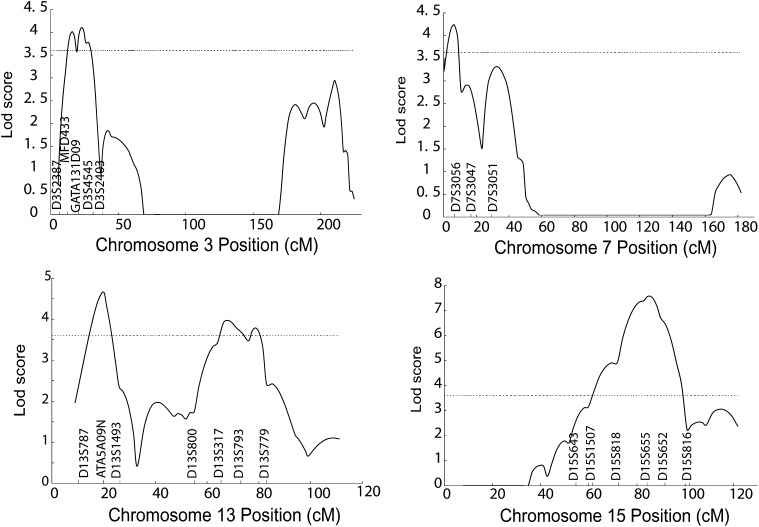
Fig. 3.
Detailed likelihood plots for significant QTLs for HDL-C on chromosomes 3p25, 7p21, 13q12, 13q32, and 15q25. The Y-axis of each plot is the LOD score; the X-axis is the marker map position. Solid lines represent the multipoint linkage analysis; horizontal dashed lines indicate the significance threshold which is equal to a LOD score value of 3.6. HDL-C, high density lipoprotein cholesterol; LOD, logarithm of odds; QTL, quantitative trait locus.

