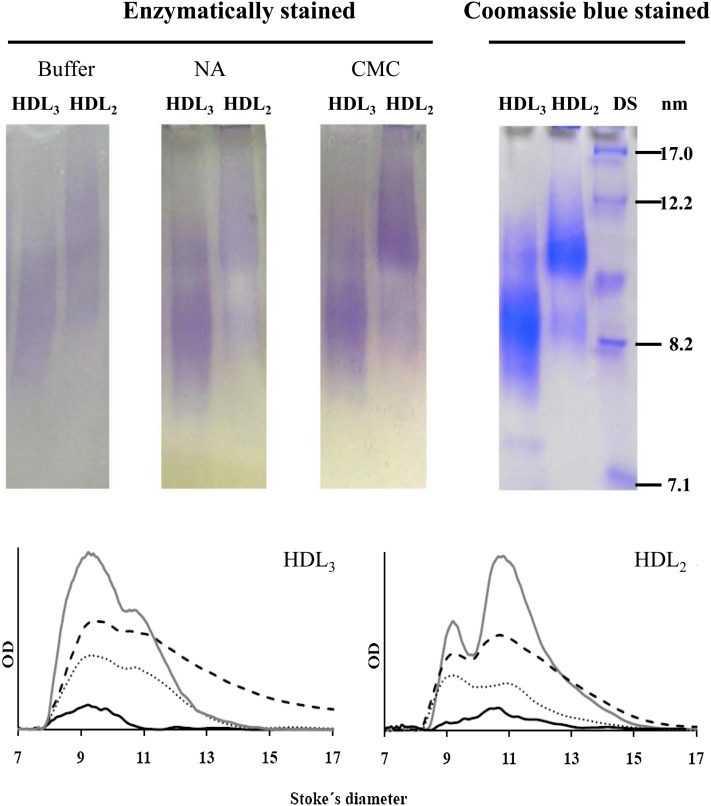
Fig. 1.
Electrophoretic scans of HDL2 and HDL3 (upper images) isolated from a pool of plasma by ultracentrifugation, further separated by PAGE, and enzymatically stained for cholesterol (left). The results obtained with the enzymatic mixture in buffer without any viscosant agent, with Nobel agar (NA) and with carboxymethylcellulose (CMC) are shown from left to right. HDL2 and HDL3 enzymatically stained using CMC are also shown after Coomassie blue staining (right), including the globular proteins used as diameter standards (DS). Densitograms for HDL2 and HDL3 (lower graphs) correspond to the enzymatic mixture in buffer (solid black line), using Noble agar (dotted line), CMC (dashed line), and stained with Coomassie blue (solid gray line). For enzymatic staining, samples were incubated 1 h at 37°C. OD, optical density.

