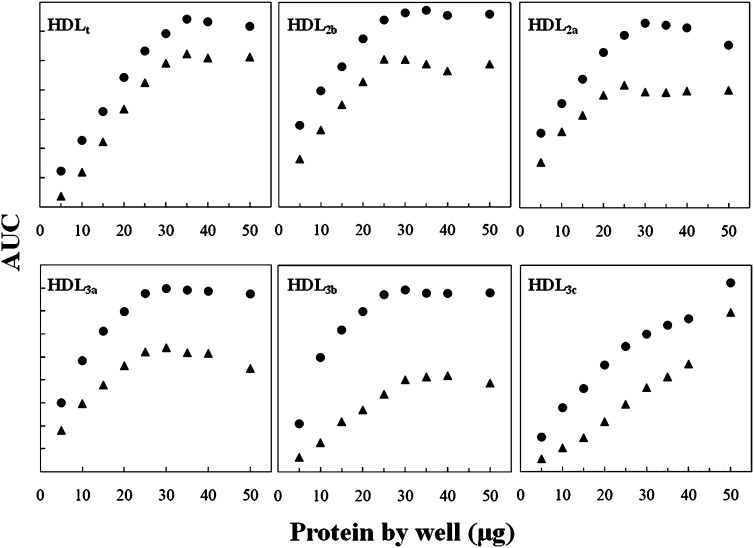
Fig. 2.
Linearity tests for enzymatic staining of cholesterol on electrophoresis gels. Total HDL (HDLt) were run in polyacrylamide 3-30% gradient gel electrophoresis, stained for cholesterol (black triangles) and further for protein (black circles). Plots represent area under the curve (AUC) obtained by densitometric analysis for HDLt and HDL subclasses (for details, see Methods section) versus protein deposited by well. For comparison purposes, protein AUC ranges were adjusted.

