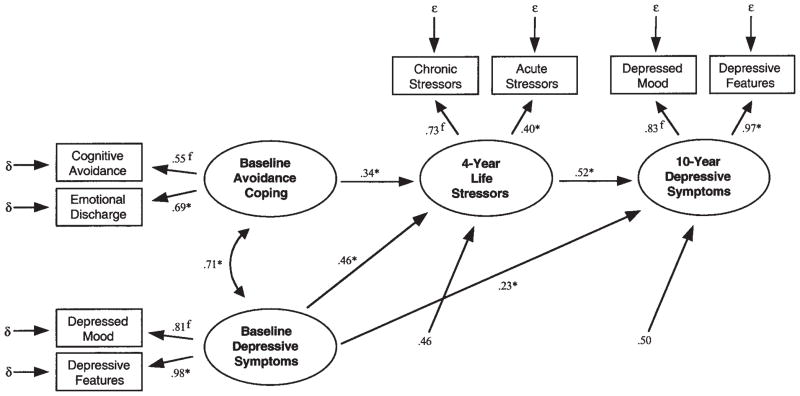
Figure 2.
Results of the LISREL test (standardized estimates) of the structural equation and measurement models predicting depression over a 10-year period (N = 1,211). Latent constructs are shown in ellipses, and observed variables are shown in rectangles. δ and ε represent unique variance in the observed X and Y variables, respectively. The unlabeled arrows pointing to the two endogenous latent variables show the residual (unaccounted for) variance for each of these variables. fParameter was set to 1.0 in the unstandardized solution. *p < .01.

