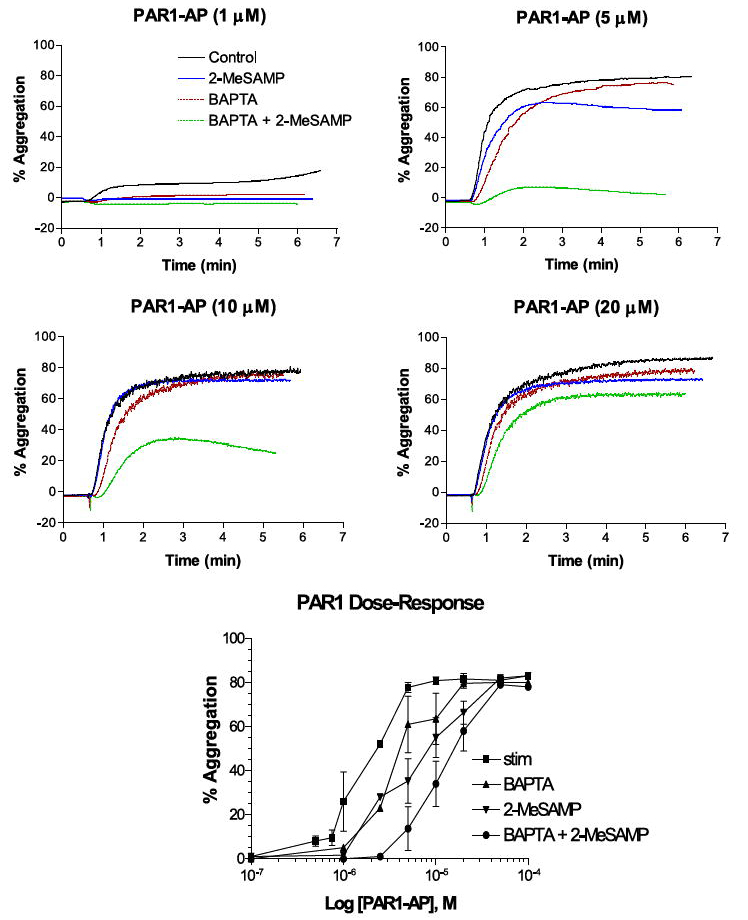
FIGURE 5. PAR1 dose-response curves to dual inhibitory effect of BAPTA and 2-MeSAMP.

Representative dose-response curves for PAR1-AP-induced aggregation at different concentrations of PAR1-AP (1–20 μm) with or without 20 μm BAPTA, 50 μm 2-MeSAMP, or both (n = 3). Bottom panel indicates composite effective dose-response curves for each condition tested. stim, stimulated.
