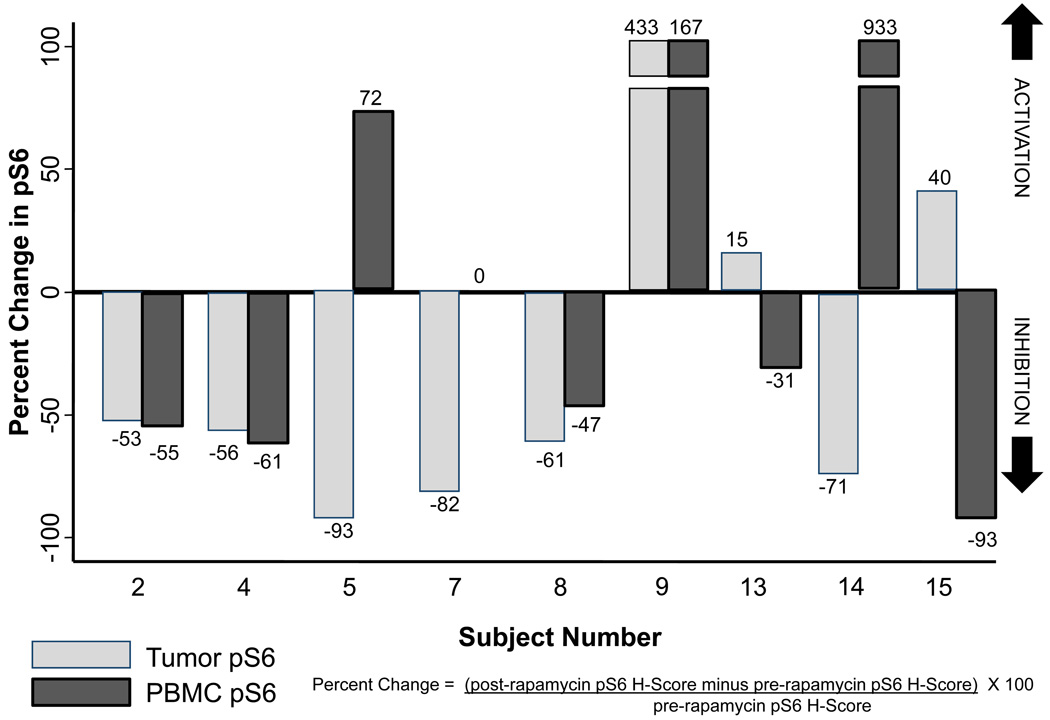
Figure 4.
Paired bar plot demonstrating peripheral blood mononuclear cell (PBMC) and prostate tumor phospho-S6 inhibition among those rapamycin-treated subjects (n=9) who had available PBMC and tumor tissue for biomarker assessment. Phospho-S6 percent change (before and after rapamycin) is calculated using the equation depicted in the figure.

