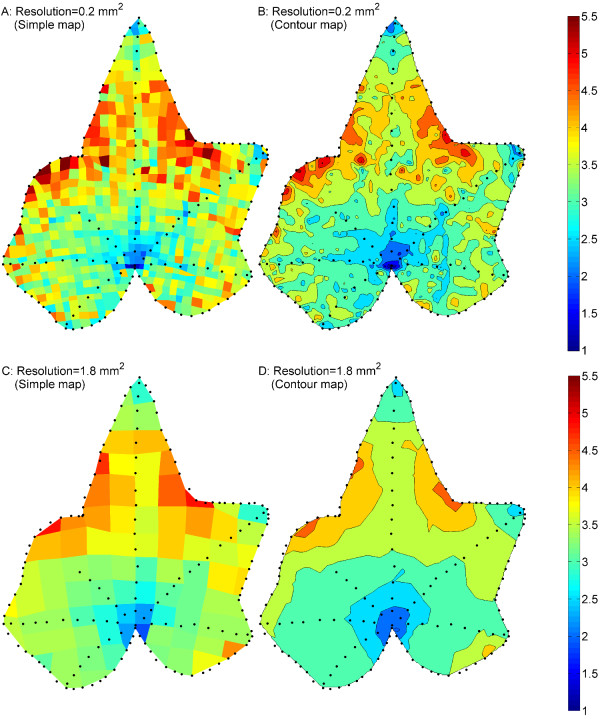
Figure 8.
Comparison of simple mapping and contour plotting with different printing resolutions. Comparisons are made on Leaf 2 at Day 10. Black dots outlined the margin and major veins of the leaf. Contour plotting provides similar information to simple mapping with the expansion variation between regions more continuous. In lower-resolution maps, some important details are missing.

