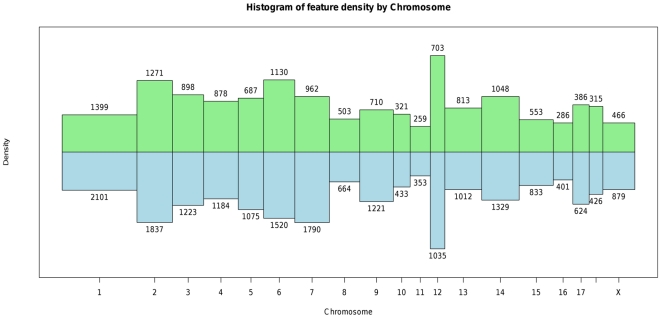
Figure 1. Histogram of oligonucleotide and gene densities across chromosomes.
Green bars pointing up represent the distribution of oligonucleotides on the microarray. Blue bars pointing down represent the distribution of genes in the pig genome assembly (Build 9, www.ensembl.org). The bar width is proportional to chromosome length in base pairs, the height of the bar is proportional to the feature density, and the area of the bar is proportional to the feature count. Counts next to each bar represent oligonucleotide (green bars) and gene counts (blue bars).

