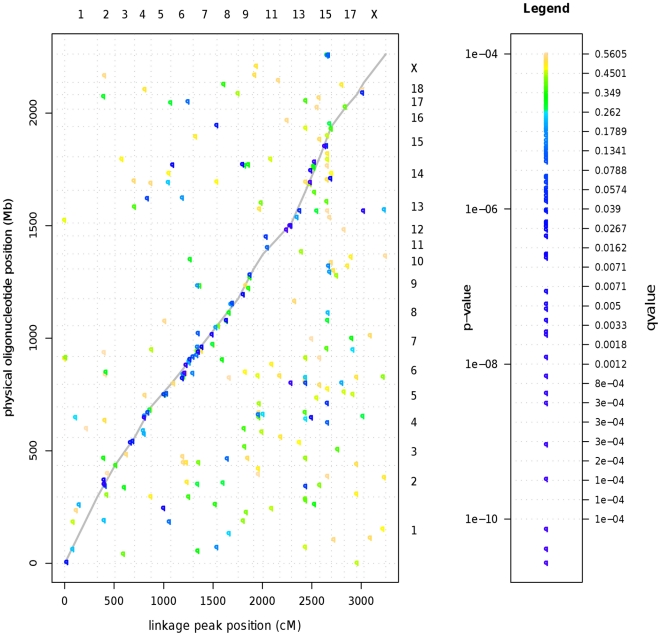
Figure 3. Global plot of physical position of oligonucleotide probe versus linkage position of eQTL across the pig genome.
Points along the gray curve represent local eQTL (most likely cis-acting), while points off the line represent trans-acting eQTL. Colors represent increasing significance from yellow to green to blue to indigo.

