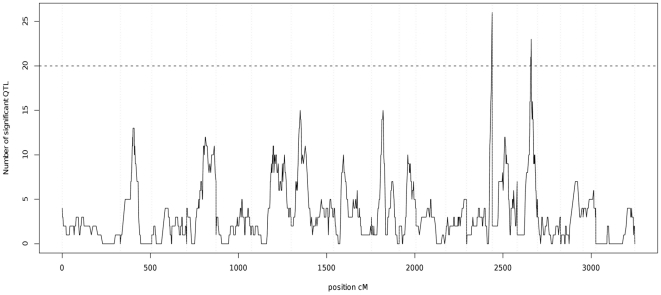
Figure 4. Number of putative eQTL per genomic position (p<0.0001).
Vertical dotted lines represent the chromosome limits in the linkage map. The horizontal line indicates the expected number of significant eQTL under the null hypothesis (of no linkage). The number of putative eQTL rises above the threshold in only two hotspots. This indicates that despite finding strong evidence of eQTL, our study does not show evidence of the presence of hotspots.

