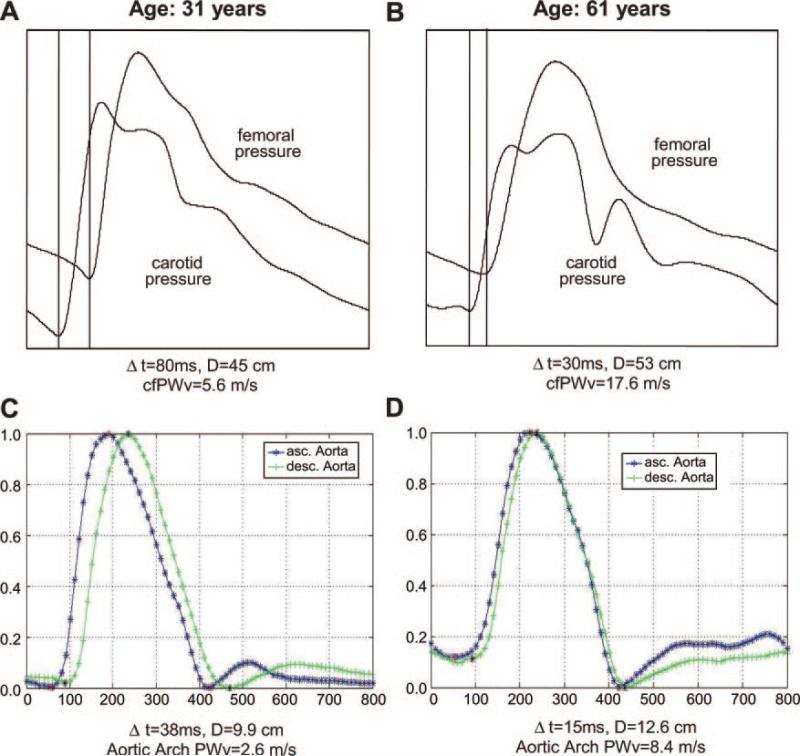
Figure 1.
Aortic arch PWV assessment with MRI and cfPWV measured by tonometry. cfPWV assessed with carotid–femoral tonometry in a young (A) and older participant (B). Corresponding measurements of aortic arch PWV (C and D) showing simultaneously acquired normalized flow curves by phase-contrast MRI in the ascending and descending aorta. The younger participant shows preserved aortic elasticity (normal pulse wave velocities), whereas the older participant presents increased pulse wave velocities in relation with a stiffer aorta. Δt indicates transit time; D, transit distance; x axis, time in milliseconds; y axis in arbitrary units.

