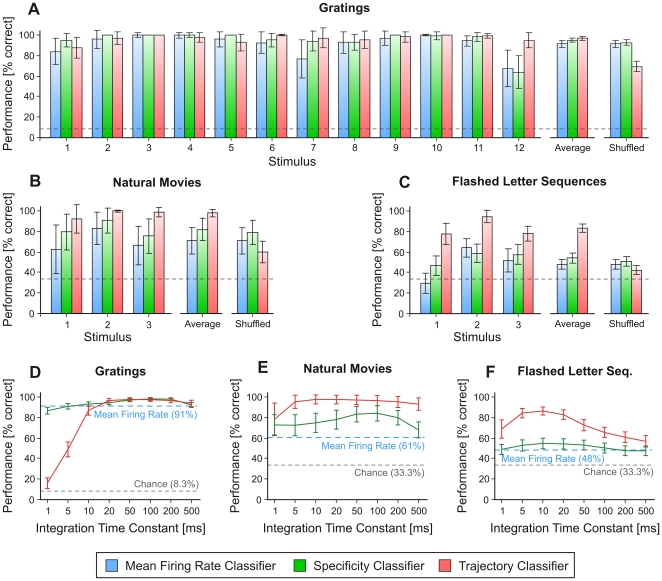
Figure 3. Information content of patterns and dependence of classification on the temporal scale.
(A)–(C) Classification performance of three classifiers with τ = 20 ms (blue: mean rate; green: pattern specificity; red: pattern trajectory) for datasets evoked with drifting sinusoidal gratings (A), natural movies (B), and flashed letter sequences (C). Shown are: performance for each stimulus condition, average performance, and average performance after shuffling the spike-trains (see text). (D)–(F) Performance is shown as a function of the integration time constant (τ) for datasets with drifting sinusoidal gratings (D), natural movies (E), and flashed letter sequences (F). Error bars represent s.d. Dashed lines mark chance levels.

