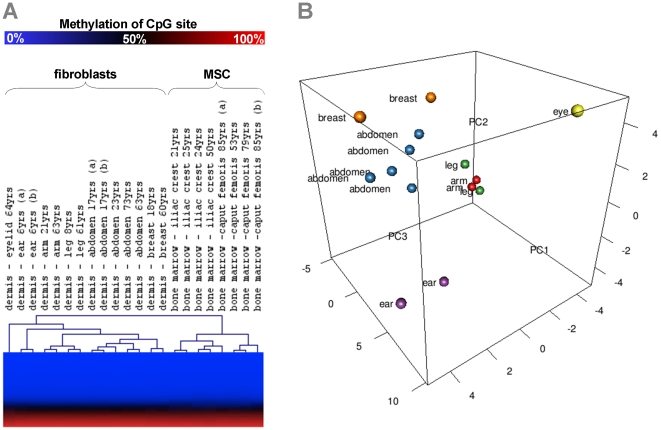
Figure 2. Relationship of DNA methylation profiles.
DNA methylation profiles of fibroblasts and MSC were analyzed with the HumanMethylation27 BeadChip that facilitates simultaneous analysis of 27,578 unique CpG sites. Unsupervised hierarchical clustering (Euclidian distance) of all CpG sites separated fibroblasts and MSC in two different groups. Furthermore, cell preparations from the same anatomical site clustered together (A). Alternatively, we used principal components analysis (PCA) to visualize the relationship of fibroblasts from different dermal regions (B).

