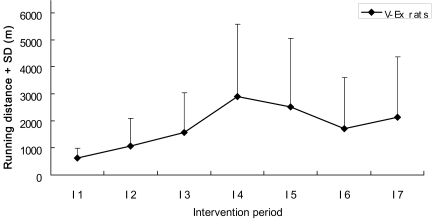
Figure 3. Exercise quantity of V-Ex rats.
The quantity of exercise undertaken by the V-Ex rats is represented by their average daily running distance. The vertical bars in the graph represent the standard deviations (SD), while I1 to I7 represent the days of intervention after surgery. The running distance of V-Ex rats was similar as that of F-Ex rats (average 622.33 m vs 600 m) on I1, but gradually increased during the intervention period.

