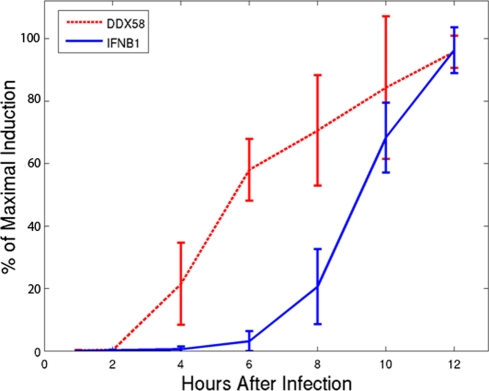
Figure 1. Time course of IFNB1 and DDX58 induction.
Measurement of IFNB1 (solid line) and DDX58 (dashed line) expression in human DCs at 1, 2, 4, 6, 8, 10, 12, 14, 16, and 18 hours following NDV infection. Percent of maximal induction was measured by microarray, compared to non-infected control, and shows that half-maximal induction of DDX58 occurs hours prior to IFNB1 half-maximal induction.

