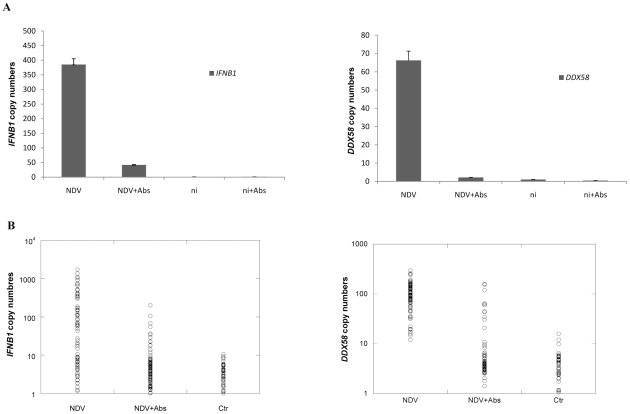
Figure 2. DDX58 and IFNB1 mRNA expression level.
2A. Total mRNA copy number. DDX58 and IFNB1 mRNA were measured by quantitative real-time PCR and the relative IFNB1 and DDX58 expression levels were normalized to ACTB. The columns show the gene expression level 7 hrs post treatment [NDV only (NDV), NDV plus blocking antibodies (NDV+Abs), not infected (ni), not infected with blocking antibodies (ni+Abs)]. Left panel: IFNB1. Right panel: DDX58. Error bars represent measurement error. 2B. Single cell mRNA expression. DDX58 and IFNB1 mRNA in individual DCs were measured 7 hrs post treatment by the hemi-nested PCR protocol illustrated in Supplementary Figure S4. The copy numbers of both DDX58 and IFNB1 in single DCs (normalized to ACTB) were determined for all cells with detectable expression of the mRNAs. Each symbol shows the gene expression in a single cell. The treatments were same as those in Figure 2A , but with uninfected DCs labeled as control (Ctr). Left panel: IFNB1. Right panel: DDX58.

