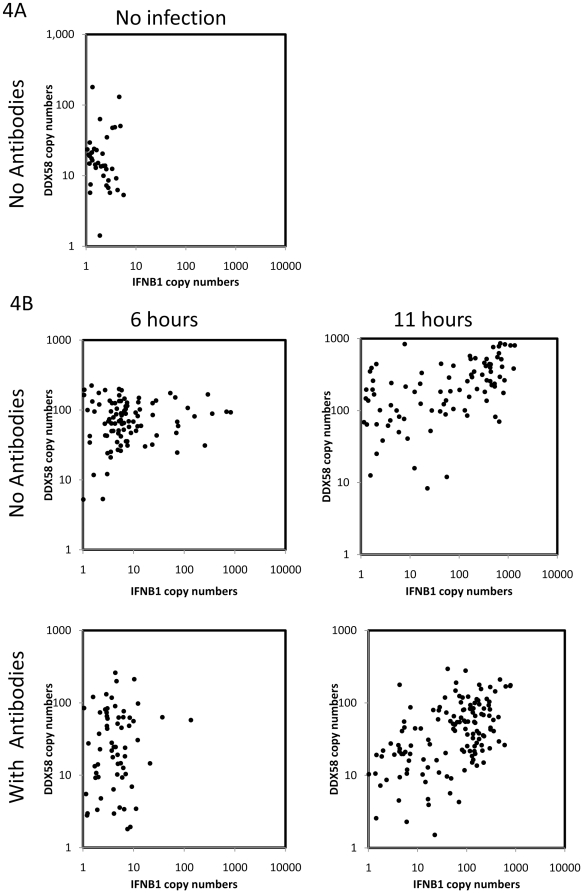
Figure 4. Experimental results in individual DCs with and without blocking antibodies.
The scatter plots display IFNB1 (X axis) and DDX58 (Y axis) copy numbers in individual cells, as determined by the hemi-nested single cell qRT-PCR, and normalized to ACTB. 4A. IFNB1 and DDX58 expression in single DCs with no NDV infection and no antibody blockage. 4B. IFNB1 and DDX58 expression in single DCs following NDV infection. In the same order as in Figure 3B, experiments without blocking antibodies (upper panels) or with blocking antibodies (lower panels) are shown at 6 hrs (left) and 11 hrs (right) post infection. Note that the dataset for 6 hours was obtained from donor 1, while the datasets for 11 hours and uninfected control were obtained from donor 2.

