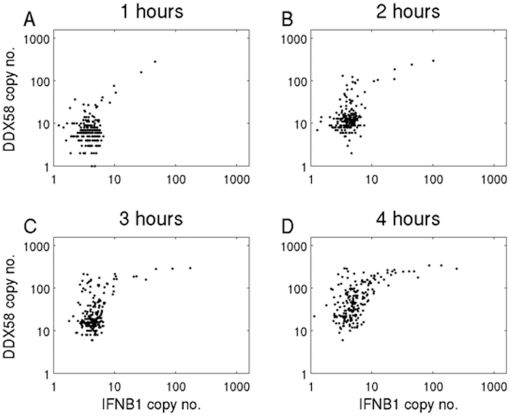
Figure 5. Single cell simulations of early responder DCs.
Simulation scatter plots of IFNB1 (X axis) and of DDX58 (Y axis) copy numbers in individual DCs at 1, 2, 3 and 4 hours post infection. The simulations were performed with 1000 cells in order to show a sufficient number of cells responding to infection at early time points.

