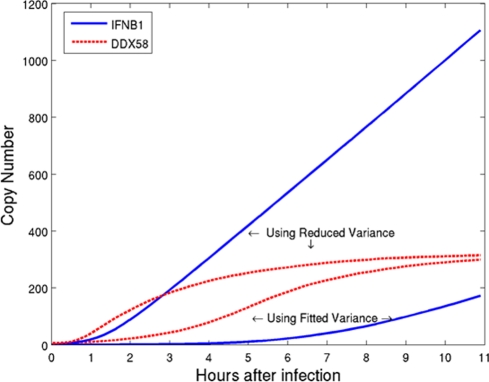
Figure 7. Single DC simulation with high and low cell-to-cell variation.
Time course of the average copy number of IFNB1 per infected cell (solid line) and of DDX58 (dashed line) obtained from the simulation with the ABM model. The lines marked by “Using Fitted Variance” are drawn from a simulation with parameters fitted to the experimental data, and are identical to the ones shown in Fig. 3A. The lines marked by “Using Reduced Variance” result from a simulation in which the variance of the initial DDX58 concentration was reduced 10-fold. In order to ensure a similar number of early responder cells, the sensitivity of IFNB1 to RIG-I concentration was increased by more than 30-fold. The reduction in variability leads to results that do not account for the observed delay in IFN induction relative to DDX58 induction. Furthermore the highly variable system generates low levels of early interferon signaling that can initiate antiviral responses without being prone to later high and potentially toxic levels of interferon secretion.

