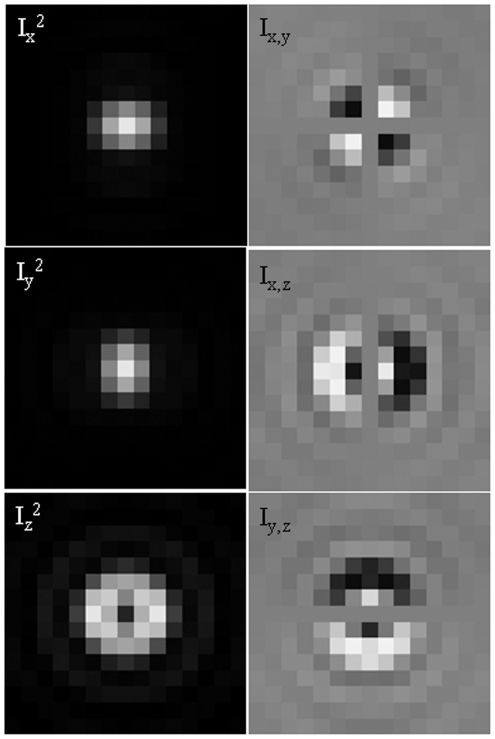
Figure 4. Dipole emission basis patterns.
Resolution shown is appropriate for the Olympus IX71, the 60X TIRF objective, and 6.45 µm square pixels. Patterns in the left column depict intensities and are always ≥0. Patterns in the right column have negative values depicted as darker than regions around the edge where values are zero. Positive pattern values are brighter than edge values. Subscripts on I represent the dipole moment components contributing.

