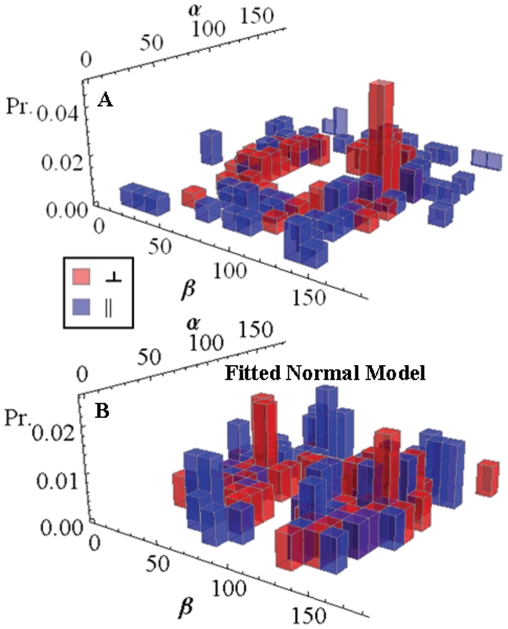
Figure 9. Orientation distribution probability histograms.
Panel A: The orientation distribution for  in fiber-coordinates (α,β) for perpendicular polarized photoactivation (red) and parallel polarized photoactivation (blue) detected from PA-GFP tagged muscle fibers in rigor. Panel B: The orientation distribution for
  in fiber-coordinates derived from simulated data from the model distribution in eq. 17 for β0 = 47, σβ = 20, γB,0 = 0, and σγ = 1 degrees. Simulated data was fitted by the pattern recognition method used to fit the muscle fiber data shown in Panel A.

