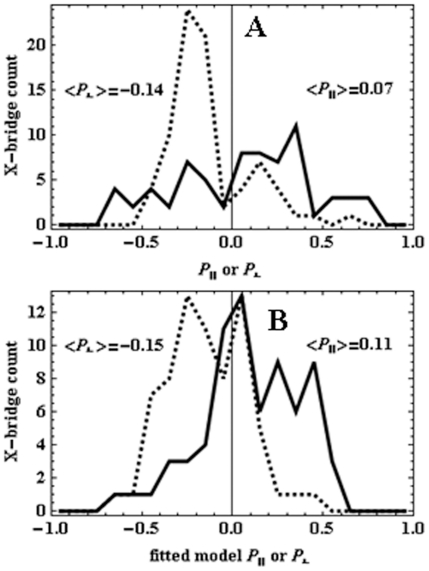
Figure 10. Polarization ratio histograms.
Polarization ratios derived from the real and simulated data in Figure 9 with dashed lines indicating P⊥ and solid lines P7. Panel A: Polarization ratios derived from PA-GFP tagged muscle fibers in rigor from Figure 9A. Panel B: Polarization ratios derived from the simulated data in Figure 9B.

