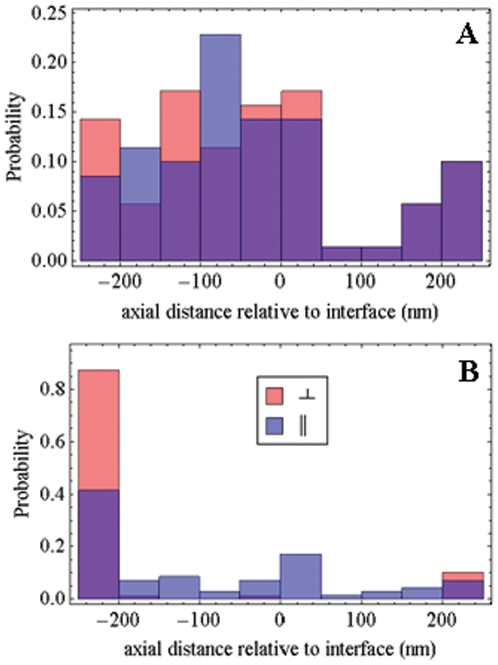
Figure 11. The probe axial spatial distribution probability histograms.
Probe axial spatial distribution from simulated data (Panel A) and data detected from PA-GFP tagged muscle fibers in rigor (Panel B). Simulated data is the same as that used in Figure 9B. Muscle fiber data is the same as that used in Figures 8, 9, 10.

