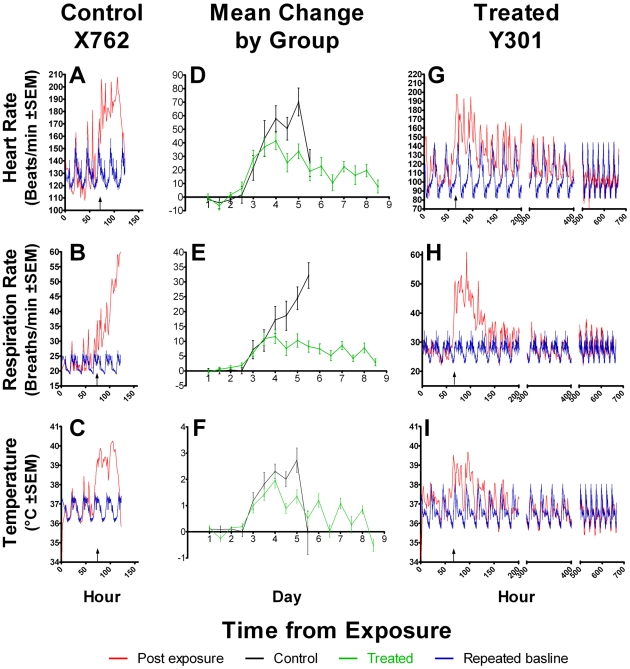
Figure 3. Heart rate, respiration rate and temperature for a control, group means, and a treated AGM.
Telemetry data is expressed as mean values for each hour post-exposure for one control untreated animal X762 (A:heart rate, B:respiratory rate, C:body temperature) and for one treated animal Y301 (G: heart rate, H: respiratory rate, I: body temperature). Post-exposure data are in red, repeated baseline averages and SEM are shown in blue. Repeated baseline averages are shown to represent the animal's physiological measurement would be without disease at that time post exposure. Group means and standard deviation (error bars) were calculated as delta values (difference between baseline value and pe value at 00:00 and 12:00 of each day) for treated or control animals (D: heart rate, E: respiratory rate, F: temperature). Group means are pooled from all three cohorts.

