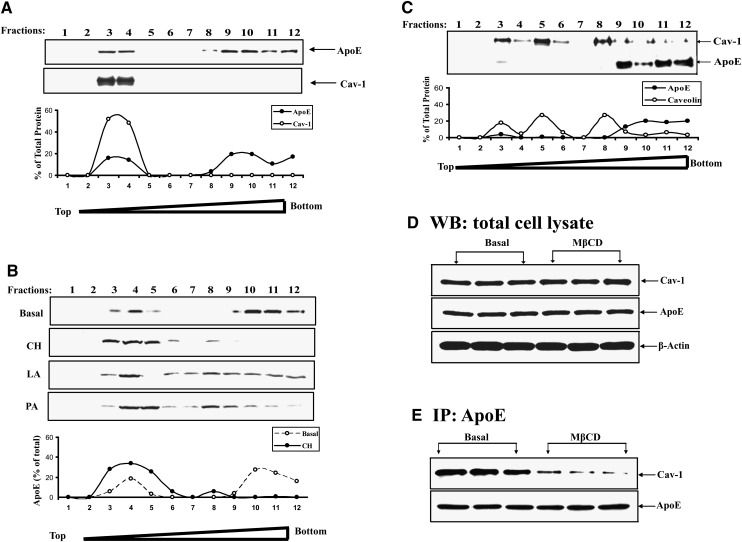
Fig. 3.
Cav-1 and apoE distribution in adipocyte caveolae isolated on discontinuous sucrose gradients. 3T3-L1 adipocytes were homogenized and separated on discontinuous sucrose gradients as described in Methods. Fractions collected from the gradient (going from lower to higher density) were utilized for Western blot for apoE and/or cav-1. A: Distribution of cav-1 and apoE in fractions collected from cells incubated in BSA. The distribution of each protein across the fractions is shown as a percentage in the graph below the Western blot. B: ApoE distribution in the sucrose density fractions was measured in cells that were preincubated in BSA alone, with 10 μg/ml CH or with 250 μM albumin bound linoleic or palmitic acid (FFA:BSA molar ratio 2.5:1) for 2 h. The percent of apoE in fractions from cells incubated with BSA or CH is shown in the graph below the Western blot. C: ApoE and cav-1 distribution in the gradient fractions after preincubation of cells in 10 mM MβCD for 50 min. D: 3T3-L1 cells were incubated in BSA or this medium plus 10 mM MβCD for 50 min. Panel shows Western blot for total cellular apoE and cav-1 in the two incubation conditions. E: Amount of cav-1 coimmunoprecipitated with apoE (under nondenaturing conditions as described in Methods) in cells incubated with or without MβCD.

