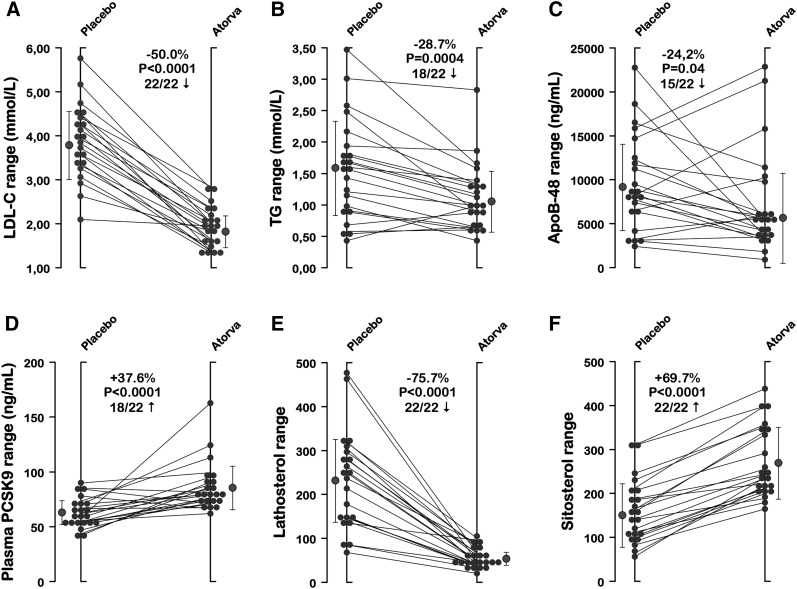
Fig. 1.
Individual responses (placebo vs. atorvastatin treatment) of the 22 participants. Data for (A) plasma LDL-C, (B) TG, (C) apoB-48, (D) PCSK9, (E) lathosterol, and (F) sitosterol are shown along with means ± SD (gray symbols). The proportion of participants’ responses moving in the same direction following atorvastatin is also provided for each variable.

