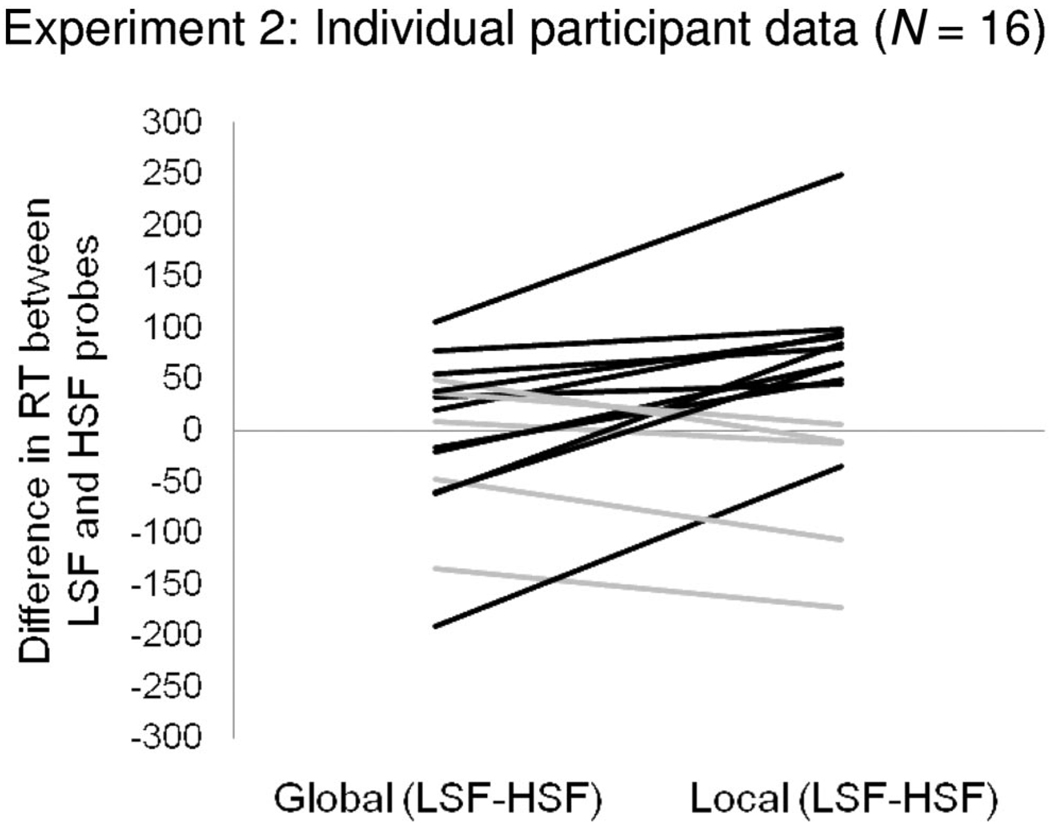
Figure 5.
Individual participant data from Experiment 2A showing the difference between reaction times (RTs) to low spatial frequency (LSF) targets minus high spatial frequency (HSF) targets in the global and local attention blocks. For most participants (shown in black), there is an increasing slope, indicating an increased difference in the local versus the global block. Participants who did not reflect this pattern are shown in gray.

