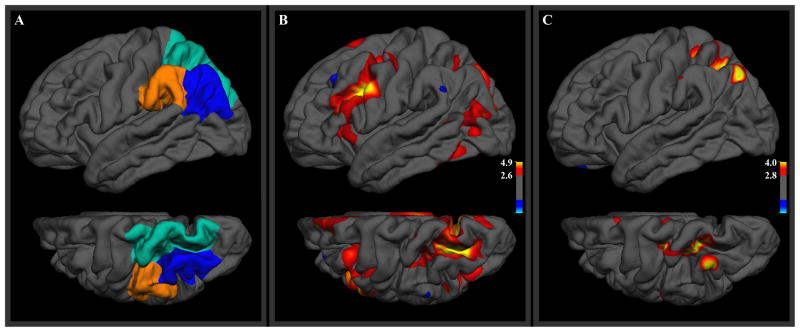
Figure 2.
(A) Three anatomical ROIs in the left lateral posterior parietal cortex. (B) Group-level t-statistics for greater BOLD response in the recall-classify condition than in the classify condition. (C) Analogous t-statistics for MEG response, averaged over the period from 0–300 ms after onset of the retrieval cue. The lower image in each frame is a superior view of the left hemisphere, rotated 30 degrees to show the intraparietal sulcus. Thresholds were set for t-statistics corresponding to controlling the false discovery rate over the left hemisphere at 0.05 (minimum) and 0.01 (maximum).

