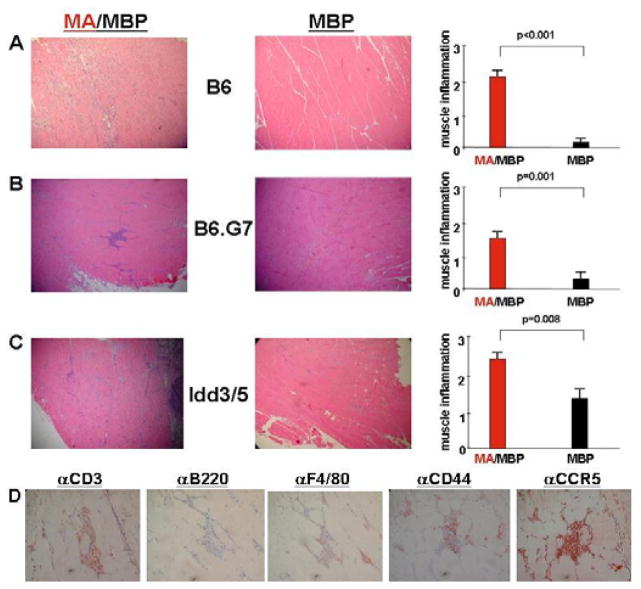
Figure 1. Induction of myositis following intramuscular immunization of murine HRS.
Panels A–C depict photomicrographs (100×) of hematoxylin and eosin-stained muscle tissue derived from MA/MBP- versus MBP-immunized mice of the indicated strains. Accompanying bar graphs represent the mean severity of muscle inflammation graded (in blinded fashion) on a scale from 0–3, as described in Materials and Methods. Error bars reflect SEM, while p values are derived from Mann U Whitney rank sum analysis. N equals the combined number of mice immunized with the indicated antigen in multiple experiments: C57BL/6 (B6), nMA/MBP=10 and nMBP=10; B6.G7, nMA/MBP=16 and nMBP=9; NOD.Idd3/5, nMA/MBP=17 and nMBP=10. In panel D, photomicrographs (400×) demonstrate immunohistochemical staining of inflammatory infiltrates resulting from MA/MBP immunization of NOD.Idd3/5 mice.

