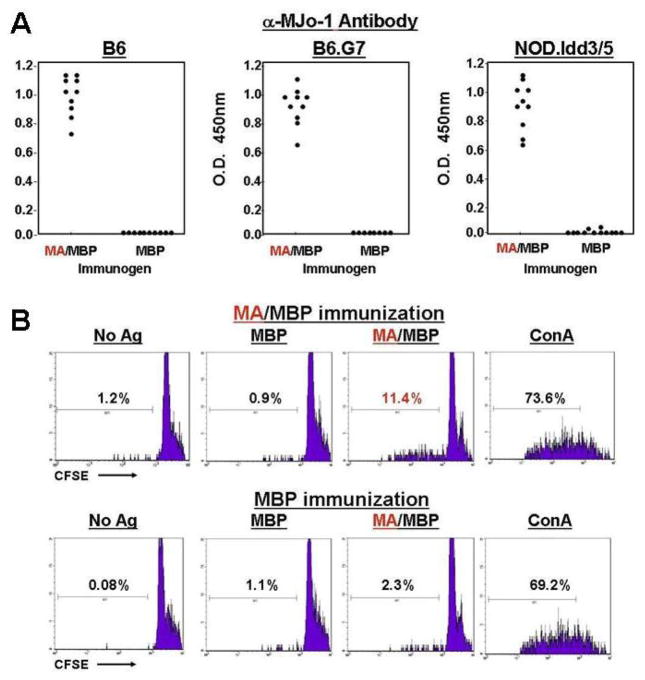
Figure 2. Development of autoantibodies and antigen-specific T cell proliferative responses following intramuscular administration of soluble HRS.
A) Dot plots depict relative anti-murine HRS (anti-MJo-1) antibody titers induced by immunization of the designated strains with MA/MBP or MBP. Individual data points represent mean OD450 values (measured by ELISA) generated by combining sera at 1:1000 dilution with wells containing recombinant MJo-1 (0.1 μg/ml). Immunizing antigens are indicated on the x-axis. Error bars are omitted given negligible SEMs. B) Individual histograms represent CFSE dilution of pooled C57BL/6 (B6) Thy1.2+ lymph node cells stimulated by the indicated antigens in 96 hour proliferation assays. While the upper panels correspond to LN-derived T cells obtained from MA/MBP-immunized mice, the lower panels reflect proliferation of LN-derived lymphocytes isolated from MBP-immunized mice. Percentages correspond to the proportion of leftward-shifted, proliferating T cells. No Ag=no antigen added, MBP=Maltose Binding Protein, MA/MBP=amino terminal fragment of murine HRS fused to MBP, ConA=concavalin A.

