
Figure 3.
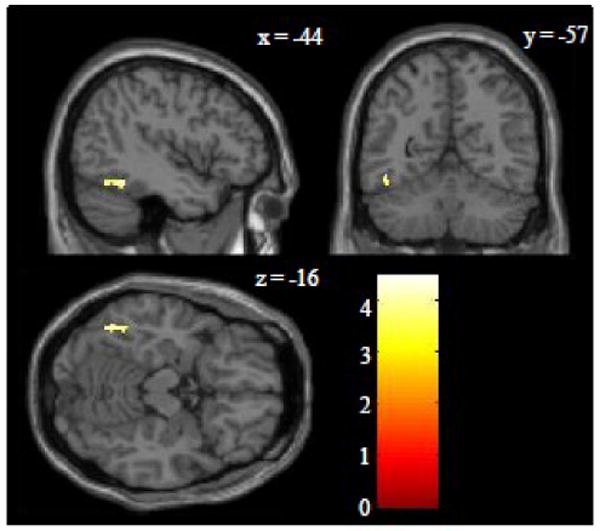
Region of interest conjunction analysis in the occipitotemporal cortex. This analysis involved a conjunction of the Spell>Motor and Read>Checker contrasts with an inclusive mask of the Spell>Fix and Read>Fix contrasts (p<0.05 uncorrected for each). The region of interest included the bilateral inferior temporal and fusiform gyri. A Z-score color scale is shown in the lower right corner. The only cluster that surpassed a corrected threshold of p<0.05 was in the left mid-fusiform (BA 37) with peak Z-score of 4.0, peak MNI coordinates of -46 -56 -14, peak TAL coordinates of -44 -52 -14, and volume of 52 voxels.