Figure 11.

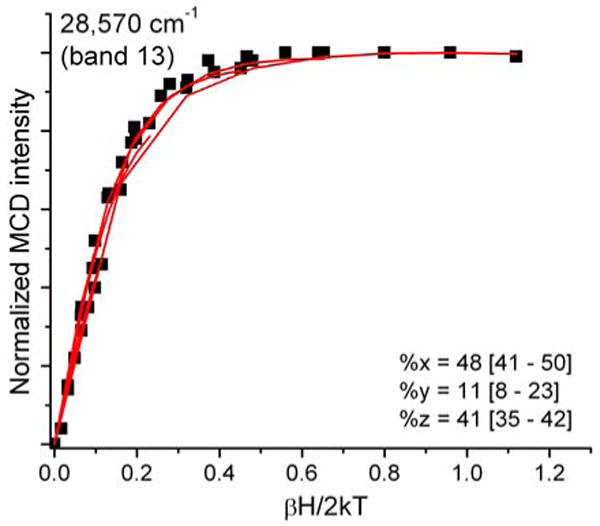
Ferric hs Q360P MCD C-term saturation magnetization curves (VTVH) for band 13 at 28570 cm-1 (red lines: fit; black dots: experimental data points) showing 41% z-polarization. Buffer conditions were the same as in Figure 5.

Ferric hs Q360P MCD C-term saturation magnetization curves (VTVH) for band 13 at 28570 cm-1 (red lines: fit; black dots: experimental data points) showing 41% z-polarization. Buffer conditions were the same as in Figure 5.