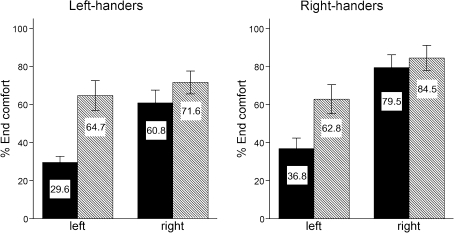
Fig. 2.
Mean end-state comfort for both handedness groups. The bars and the numbers in them depict the percentages of trials in which participants ended their movements comfortably, separated for the left and right hands and for horizontal endings (filled bars) and vertical endings (hatched bars). The error bars display two standard errors. The data for right-handers (right graph) are adapted from Janssen et al. (2009)

