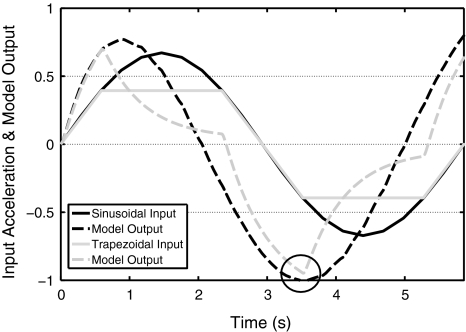
Fig. 3.
Example of an input profile (solid black curve), for which the amplitude is at threshold level. The corresponding output of the transfer function model has a maximum absolute value of one (black circle). The solid gray input curve is just below threshold level, because the output does not reach a maximum value of one

