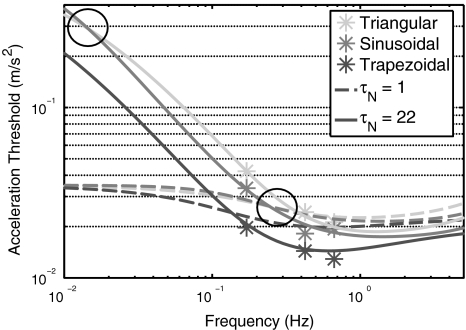
Fig. 5.
Comparison of predictions calculated with a model which had a high value for τN versus a model which had a low value. Both models show a crossover between the lines describing the thresholds for the triangular and the sinusoidal profile (black circles). For the model with τN = 1 the crossover occurs in the frequency range measured, but only one participant actually showed a crossover

