Figure 2.
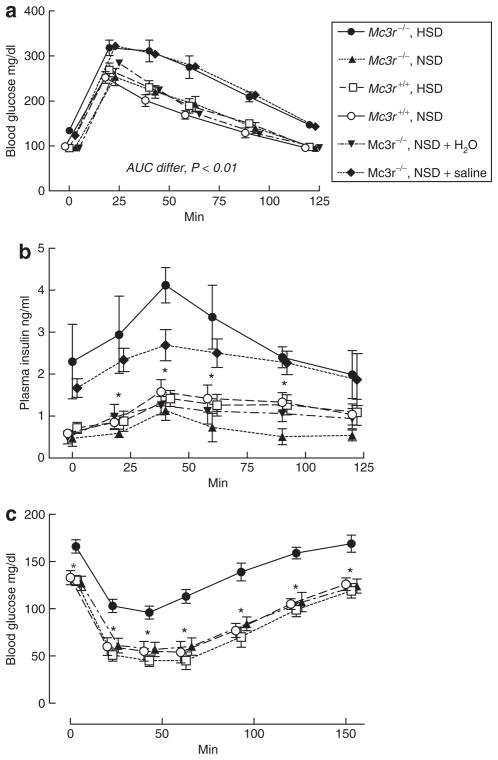
(a) Blood glucose concentration during a 2-h glucose tolerance test in Mc3r+/+ and −/− mice fed the normal- (NSD) or high-sodium diet (HSD), and in Mc3r−/− mice fed the NSD but given either tap water or normal saline as drinking water. Mc3r−/− on the HSD and on the NSD with saline drinking water had a significantly greater area under the glucose-time curve than wild-type mice fed either diet or Mc3r−/− mice ingesting the NSD and drinking tap water. (b) Plasma insulin concentrations in the experiments shown in a. Mc3r−/− mice on the HSD or on the NSD plus saline drinking water were hyperinsulinemic throughout the glucose tolerance test compared to wild-type mice on either diet or knockouts on the NSD. (c) Blood glucose concentration during a 150 min insulin tolerance test. Blood glucose fell significantly less in Mc3r−/− mice fed the HSD compared to the other groups, suggesting blunted insulin-mediated glucose uptake. N = five mice per group; *values in Mc3r−/− mice on the HSD and on the NSD plus saline drinking water significantly different from the other three groups, P < 0.05 or greater by one-way analysis of variance.

