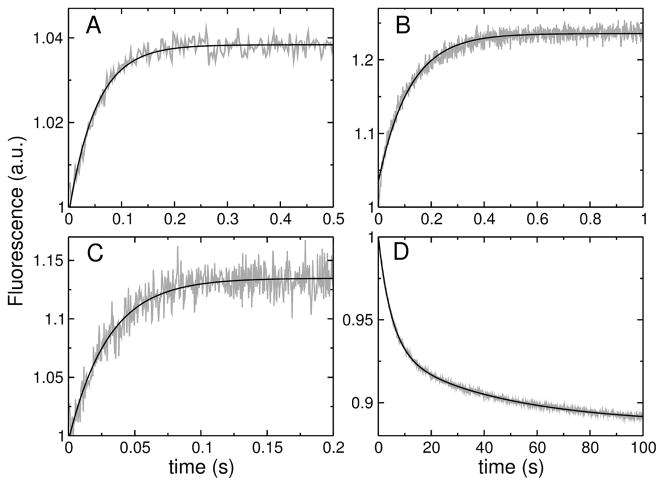
FIGURE 3.
(A–C) Examples of binding kinetics of the peptides (1 μM) to POPC LUV (100 μM lipid): (A) TPW-1, (B) TPW-2, and (C) TPW-3. The signal (gray traces) is the fluorescence emission of the lipid fluorophore 7MC-POPE incorporated in the membrane, which results from FRET, upon excitation of the Trp residue on the peptide. The lines are single exponential fits to the data. (D) Dissociation kinetics of TPW-2 from POPC. TPW-2 (1 μM) was pre-equilibrated with POPC LUV containing 7MC-POPE (donor vesicles, 100 μM lipid), which were mixed in the stopped-flow system with an excess of unlabeled POPC LUV (acceptor vesicles, 1000 μM). After mixing, the concentrations are halved: 0.5 μM peptide, 50 μM donors, and 500 μM acceptors. The signal recorded (gray trace) is the decrease in FRET as the peptide dissociates from the labeled POPC membranes. The black line is a double exponential fit to the data.

