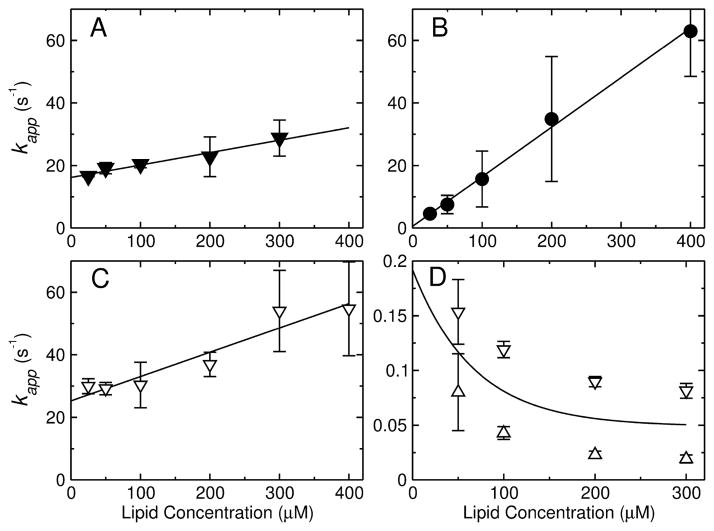
FIGURE 4.
(A–C) Kinetics of peptide binding to POPC LUV. The apparent rate constant (kapp) obtained from binding kinetics is plotted against the lipid concentration for (A) TPW-1, (B) TPW-2, and (C) TPW-3. The points represent mean values and standard deviations from 2–4 independent experiments, and the lines are linear regressions, which yield kon (slope) and koff (y-intercept). (D) Kinetics of TPW-2 dissociation from POPC LUV. The kapp for dissociation from POPC LUV is plotted as a function of concentration (after mixing in the stopped-flow) of the donor vesicles. The concentration of the acceptors was constant (500 μM). The upper and lower bounds on kapp are shown (open triangles), which are means and standard deviations from 2 independent experiments. The extrapolation of the mean of the two bounds (solid line) to zero concentration of the donor vesicles provides the best estimate of koff in the dissociation experiment.

